With the recent Democratic sweep of Congress, fears of inflation have elevated in financial markets. Every day on the financial news, someone is arguing that we will soon be faced with runaway inflation due to reckless fiscal and monetary policies. This rhetoric has led to a rise in intermediate and long-term interest rates. We’ve shared our opinions on the likelihood of inflation several times but feel compelled to address the topic again. In several notes since September we have argued that while the fear of inflation will force interest rates higher in the short run, we don’t see the set up for a long-term increase in inflation. Based on this, we believe that any increase in rates will be short lived as inflation fails to remain elevated.
In our note from September 18th, we highlighted demographics and debt levels as two keys to the long-term deflationary scenario. Today we’d like to address the Monetary Exchange Equation and the Inflation Identity and how the components of those equations interact to produce inflation. We’ll follow up with a few more reasons why we don’t see a 1970s style inflation scenario in the foreseeable future.
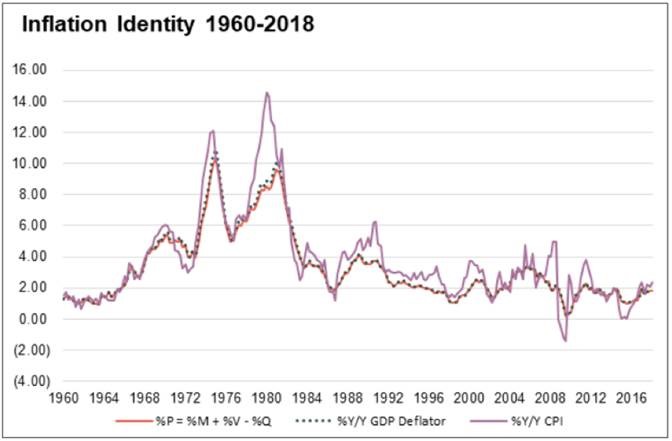
The Monetary Exchange Equation is not a theory based on probability but is a mathematical identity, meaning the results are true no matter the value of its variables. It is (P) Price Level times (Q) Real Output equal to (M) the monetary base times (V) the velocity or turnover of the monetary base – PQ=MV. Using simple algebra, we can rearrange the equation to solve for inflation. The Inflation Identity is written as: (^P) The change in prices is equal to (^M) the rate of change in the monetary base plus (^V) the rate of change in velocity minus (^Q) the rate of change in real output growth – ^P=^M+^V-^Q.
We can see that inflation is impacted by the growth of the monetary base, the change in how quickly that money is spent and the amount of goods and services produced. Each component is equally important to inflation. This Inflation Identity is also knows as the GDP deflator which is used by central banks in their monetary policy analysis. While it doesn’t match completely with CPI it does have a 0.93 correlation with CPI from 1960-2018.
Let’s address each component of the identity to better understand the dynamics driving inflation.
^M – The rate of change of the Monetary Base
This factor is the only one directly controlled by the central bank. To increase the monetary base, the Federal Reserve engages in transactions with the financial markets. The Fed purchases financial instruments like Treasury Bonds or Agency Mortgage Backed Securities. They exchange cash for bonds thus increasing the amount of money in circulation while at the same time reducing the financial instruments in circulation. To reduce the monetary base, they reverse this process. So effectively, they are only exchanging one type of asset (cash) for another type of asset (bonds). No new wealth is created, it just transforms into a more liquid asset.
^V – The rate of change of the Velocity of Money
Velocity is calculated as Nominal GDP divided by the Monetary Base. Velocity is a measure of people’s willingness to hold cash. It basically measures how quickly money gets spent. The more willing people are to hoard cash and not spend it, the lower velocity is. Velocity usually declines during times of credit distress, economic weakness or when there are fears of bank solvency. It is also usually correlated to interest rates. The lower interest rates are the less “penalty” there is for holding cash.
^Q – The rate of change of Real Output
Real Output is what the economy produces. It is usually measured by Real GDP. Real GDP is the aggregation of all the economic activity in the country and measures the amount of goods and services produced at stable prices.
So now lets look at what is happening in these components.
During 2020, the broadest measure we receive of the monetary base (M2) increased by an annual average rate of 19.4%. This enormous jump was driven by emergency actions by the Federal Reserve to combat the economic collapse as a result of the COVID-19 lockdowns. The Fed cut short-term interest rates to 0% and increased its purchases of financial assets to $80 billion in US Treasuries and $40 billion in Agency MBS per month. Through these asset purchases, the Federal Reserve increased its balance sheet by $3.2 trillion during 2020. In isolation, an increase of this size in the monetary base would have had an enormous impact on prices. However, other factors in the Inflation Identity offset this surge in the monetary base.
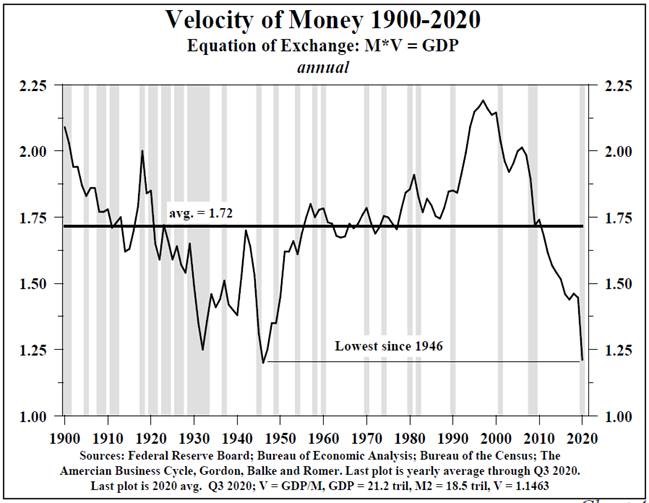
Velocity in 2020 declined to the lowest level since 1946 at 1.2x. The new liquidity provided by aggressive Federal Reserve actions didn’t get spent. Well then where did the $3.2 trillion in funds go? A lot of the funds are sitting in the Bank Reserve accounts at the Federal Reserve. Banks are required to hold a certain amount of money with the Federal Reserve based on their deposit size. These required reserves allow for the effective functioning of the banking system. Banks can choose to hold more reserves if they wish. These funds are called excess reserves. Excess reserves just sit there collecting the interest the Fed pays on excess reserves called the IOER (usually an amount just below the Fed Funds Rate). Excess reserves in 2020 exploded by $1.7 trillion. That absorbed a bunch of the monetary base increase. In addition to the banks hoarding cash, the public followed a similar path. Households paid down debt, increased savings and cut spending throughout the year. In fact 75% of government stimulus funds this past year went to debt reduction and savings.
In addition to a decline in velocity, real output also contracted during the year. We don’t know the final GDP growth number for 2020 yet but estimates are between -3 to -4% for the full year. That is a very serious decline in full year GDP. Counter-intuitively declining Real GDP increases the inflationary impulse all things equal as fewer goods and services are chased by the same amount of monetary base. If the pullback in spending hadn’t been so large, the Real GDP decline would have increased inflation this past year.
So as you can see, inflation is a bit more complicated than just looking at the change in the monetary base as many pundits would have you believe.
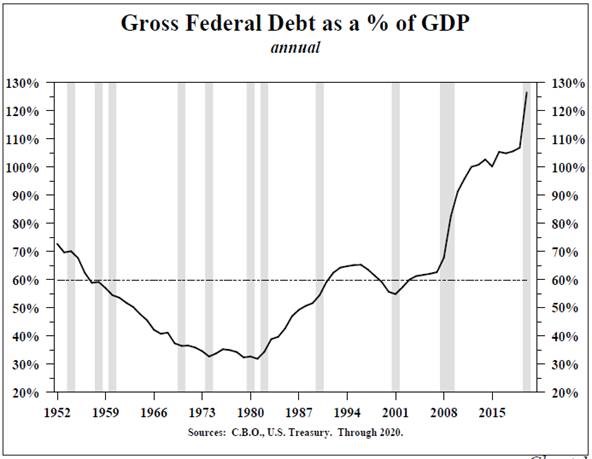
Going forward, inflation still has an uphill battle. As we highlighted in our September 18th note, the current demographic and debt situations are highly deflationary and will create a very strong headwind for sustainable inflation.
In the last few months, we’ve seen big price increases in some commodity products like steel, oil, copper, wheat, corn, etc… Most of these price issues are a function of reduced supply due to shutdowns and lost productivity from the virus. We expect these increases to be transitory as supply chains are rebuilt as the economy normalizes. The price increases have caught the attention of the bond market and these increases coupled with the large spending plans of the government have spooked fixed income markets. Yields have risen and many are forecasting much higher rates ahead based on inflation.
For us the decision to own bonds is not based on whether rates can rise from here (as they transitorily do every year), but whether rates can stay elevated, which is a function of baseline inflation over time. In addition to the demographic and debt headwinds, there are a few more reasons we think inflation and therefore rates will remain low for a long time. First, the destruction of wealth from this past year that is not captured in GDP; second, the fiscal multipliers of US government spending.
2020 Wealth Destruction
The recession has created an enormous destruction of wealth in the US. Millions of people have lost jobs and income while many more have lost their homes and businesses. David Rosenburg has highlighted a few statistics that show the widespread destruction:
- Government benefits now account for nearly 20% of personal income
- 25% of households haven’t been able to meet their monthly bills since March
- 7% of homeowners are in some sort of mortgage forbearance
- 33% of households dipped into long term savings or retirement accounts to pay bills
- 17% of households borrowed money from family or friends to pay bills
GDP measures new output. It has no capability of subtracting from the output the destruction of wealth caused by the recession. The defaulted loans, lost businesses and reduced savings are not captured in GDP. As the economy begins to recover, GDP will accelerate but we will still be digging out of a huge hole from 2020.
Negative Multiplier
The intent of increased government spending during a recession is to stimulate a durable recovery in economic activity. The knock-on effects of stimulus spending are called multipliers. Multipliers are the intermediate term impact of that spending. Positive multipliers provide a longer term boost to GDP growth, while negative multipliers limit or constrain longer term GDP growth. It is critical to know if a country’s spending has a positive or negative multiplier to determine longer term economic impacts. In a 2012 article in the Journal of Monetary Economics, Ilsetzki, Mendoza and Vegh provide a framework for evaluating the multiplier of spending in a country.
- Developed industrial countries respond with a positive multiplier (USA +)
- Economies operating under flexible exchange rates have a negative multiplier (USA -)
- Countries that are open to trade have a negative multiplier (USA -)
- The government spending multiplier is sharply negative in highly indebted countries (USA -)
- Highly indebted is defined as government debt to GDP over 60%
- The composition of spending is critical (USA -)
- Spending on physical infrastructure, health and education are positive – other spending has negative multipliers
As we look at the US, the composite multiplier of the 2020 stimulus will be negative for the economy over the intermediate term. Any boost from the stimulus will be short-term followed by an increasing headwind to GDP growth.
The punchline—we think that the rebound in commodity inflation occurring right now will not last. As the economy normalizes, supply chains will heal and commodity prices will rebalance. The consumer has suffered a lot of damage and will need time to recover. Increasing government debt will be a drag on further GDP growth and when combined with an aging demographic will limit inflation over the next decade. Monetary policy has been unable to create inflation for a decade and will fail this time as well.
The US is traveling down a well-worn path of increasing debt, aging populations and decreasing productivity growth. Japan and Europe are a decade ahead of us down this road. Both those economies have 10 year government interest rates that are NEGATIVE (meaning you pay them to borrow your money). If we remain on this path, US interest rates have a long way to fall which would mean increasing bond prices.
So what would make us change our outlook on inflation?
If Congress were to change the Federal Reserve Act to allow the Fed to bypass the banks and directly inject money into the economy, our thesis would shift. Right now the Fed cannot and does not “print” money. That function is performed by the banks through fractional reserve lending. If the law changed so that the Fed itself could “print” money and hand it out we believe that ^M and ^V would align so that inflation would increase.