Currently, the news is full of articles proclaiming economic turmoil and forecasting recession. Just this month, we’ve noted stories on rising inflation, gas price shocks, frozen home sales, increasing unemployment and record consumer debt defaults. Yet, despite all of these negative data points, the stock market continues to surge higher.
This week we’d like to address this disconnect between the consumer economy and the financial markets.
The April 2026 Gallup Economic Confidence Survey showed 47% of respondents felt the economy was poor and 73% of respondents felt that the economy was getting worse.
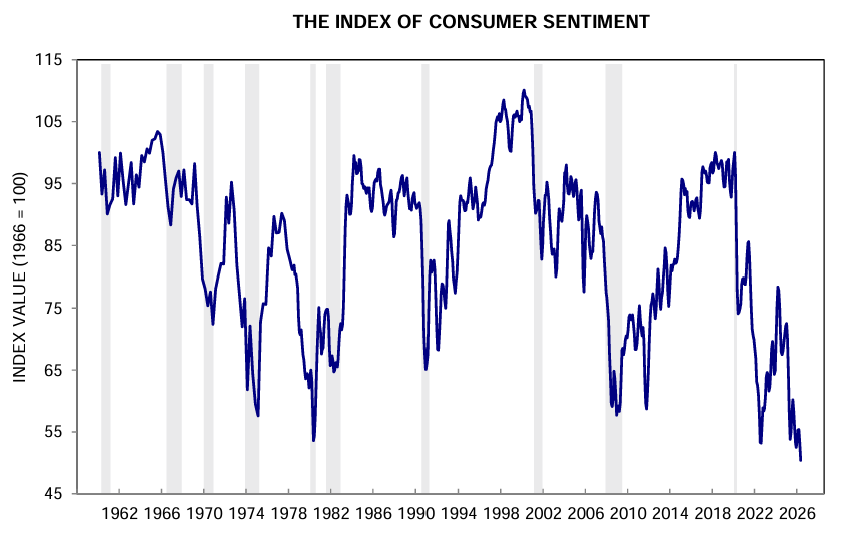
This month the Index of Consumer Sentiment hit its lowest level in history.
So why are consumers so pessimistic? We believe it is a combination of the following factors:
- Inflation of the Cost of Living
- Rising Unemployment
- High Debt Levels at High Interest Rates
Inflation of the Cost of Living
Since the end of Covid, inflation has averaged 4.7% annually producing a 26% increase in the general price level. However, many basics of life have seen a much higher rate of increase. Home prices have risen by 37%, electricity by 39%, gasoline by 42%, car insurance by 43% and heating oil by 63%.
Rising Unemployment
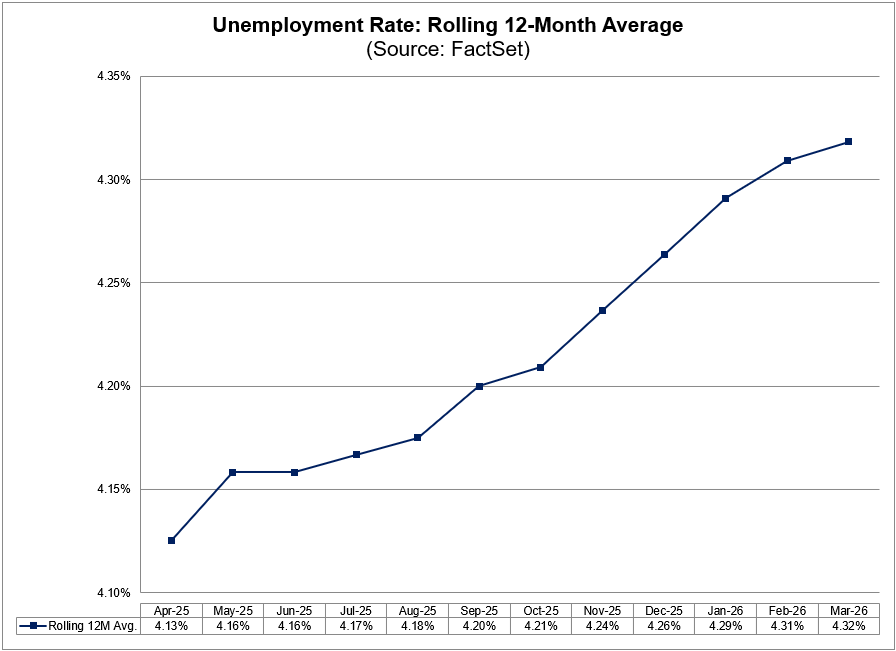
In April, the trailing 12 month unemployment rate reached 4.32% or 7.4 million persons unemployed. This number has been steadily rising over the last year.
However, this number doesn’t quite tell the whole story. Those with part-time jobs due to economic reasons rose to 4.9 million and those who are not counted in the labor force but want a job hit 6.1 million people.
High Debt Levels at High Interest Rates
Total US Household debts reached a record $18.79 Trillion in Q1 2026. Obviously, the bulk of this debt was in mortgages. The state of the existing mortgage market is pretty healthy with default rates at just 1% due to the average existing mortgage interest rate being under 4%.
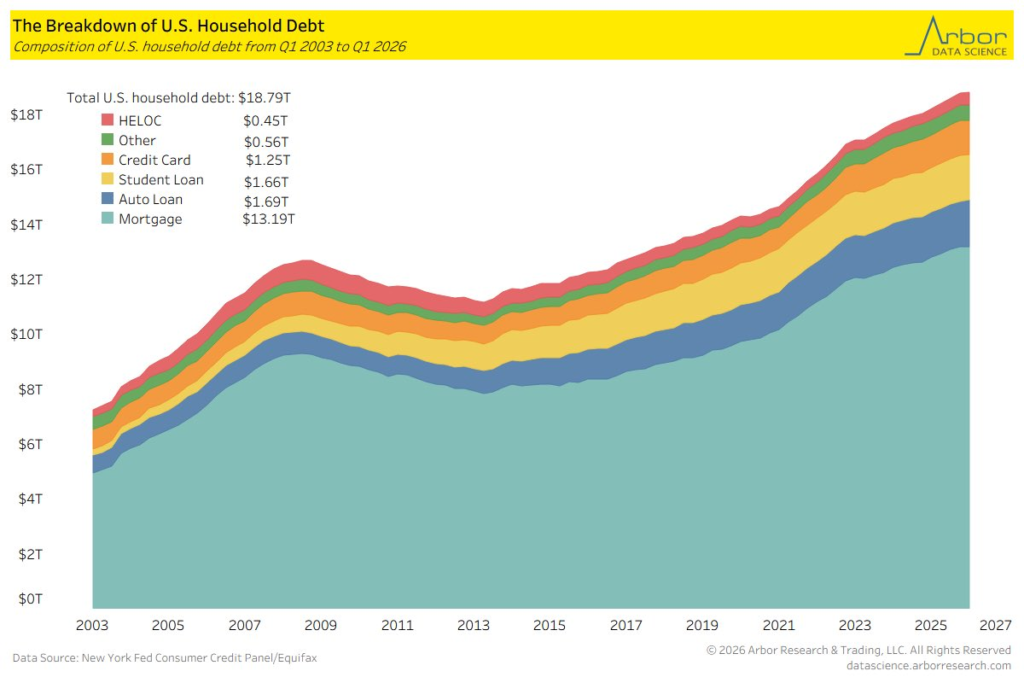
Unfortunately, other types of consumer debt are showing signs of severe distress. The $1.69 Trillion auto loan market has a 5.6% default rate. This is higher than the peak default rate during the global financial crisis. Average car loan rates are over 10% with the average monthly car payment just shy of $800.
Student loan defaults also continue to be extreme at 10.3%. Unlike other forms of consumer debt, student loans cannot be discharged in bankruptcy leading to ever higher fines, fees and accrued interest.
The $1.25 Trillion credit card market has an average interest rate of 25%. This has led to the highest credit card default rate since 2010 at 13.1%.
So if the consumer is struggling with buying groceries, electricity and paying rent, why is the stock market doing so well?
Corporate Earnings. We’ve been pushing this narrative hard these last few months and for good reason. Coming into the earnings reporting period, investors expected corporate earnings to have grown by 13.1% year-over-year. As we’ve mentioned several times, earnings have been much better than expected.
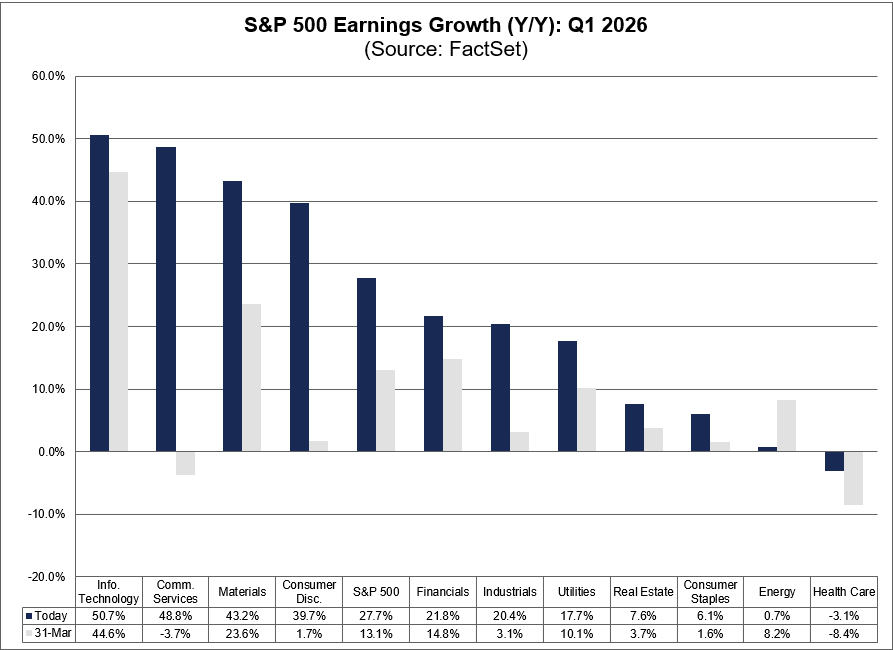
With nearly all of the large companies reporting, year-over-year earnings in the first quarter grew by 27.7%.
As you can see from the graphic above, the majority of that growth has come from Tech, Communications and Consumer Discretionary—all sectors that we are overweight in our portfolios.
Investors also expect the earnings growth strength to continue for the foreseeable future. Thus, stocks are getting bid up despite the struggles of the average household.
Could the weakening consumer eventually have a negative impact on the markets? Sure, but given the current earnings drivers, we don’t expect that to happen in the next few years.