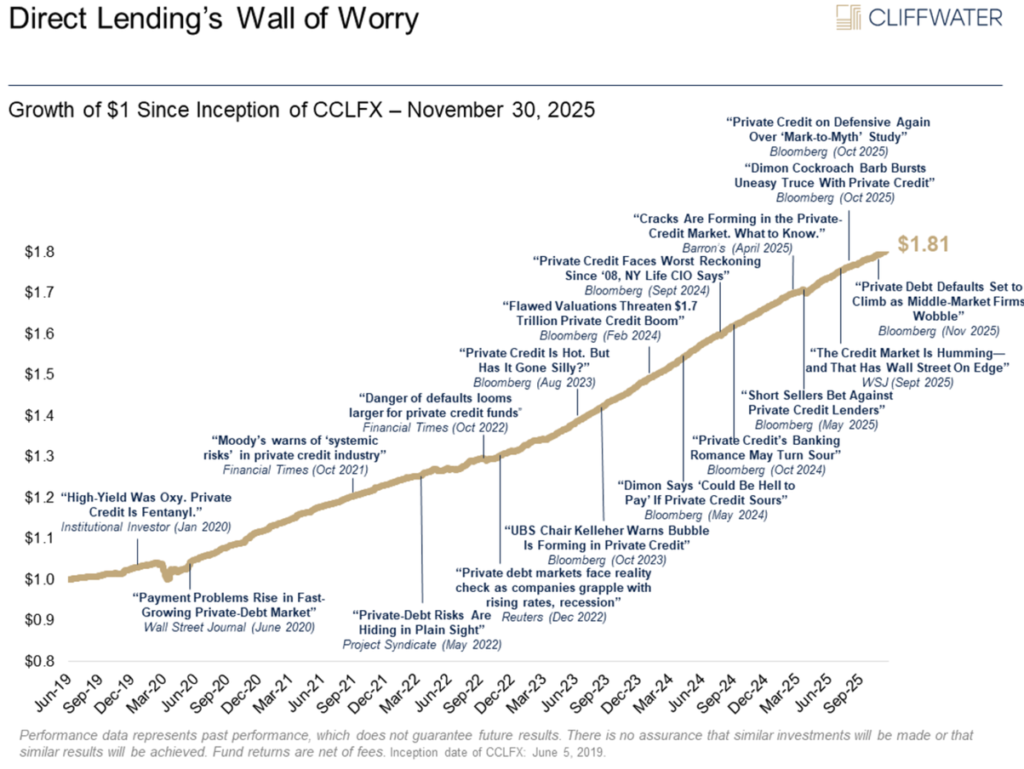
This week we wanted to focus on private credit, which has faced a difficult few months in the press. As you know, we have private credit exposure that we continue to believe is well positioned. That said, when an asset class we own comes under this much skepticism, we feel it’s worth re-examining the evidence. While negative headlines have ramped up recently, this is not the first time it has come under scrutiny.
We believe the current headlines are conflating different problems into a single narrative. In our view, the underlying credit data tells a more differentiated story.
Our assessment is straightforward: Concerns about private credit are not new, and they will not stop. That is what happens when an asset class grows to over $2 trillion; it attracts attention. Some of that attention is warranted, and we address the most relevant points below. But private credit is not one thing. It spans a wide range of borrowers, structures, and risk levels, and treating it as a single investment is like judging the entire stock market by its worst-performing sector. The distinctions matter, and that is where we want to focus.
Examining Historical Returns
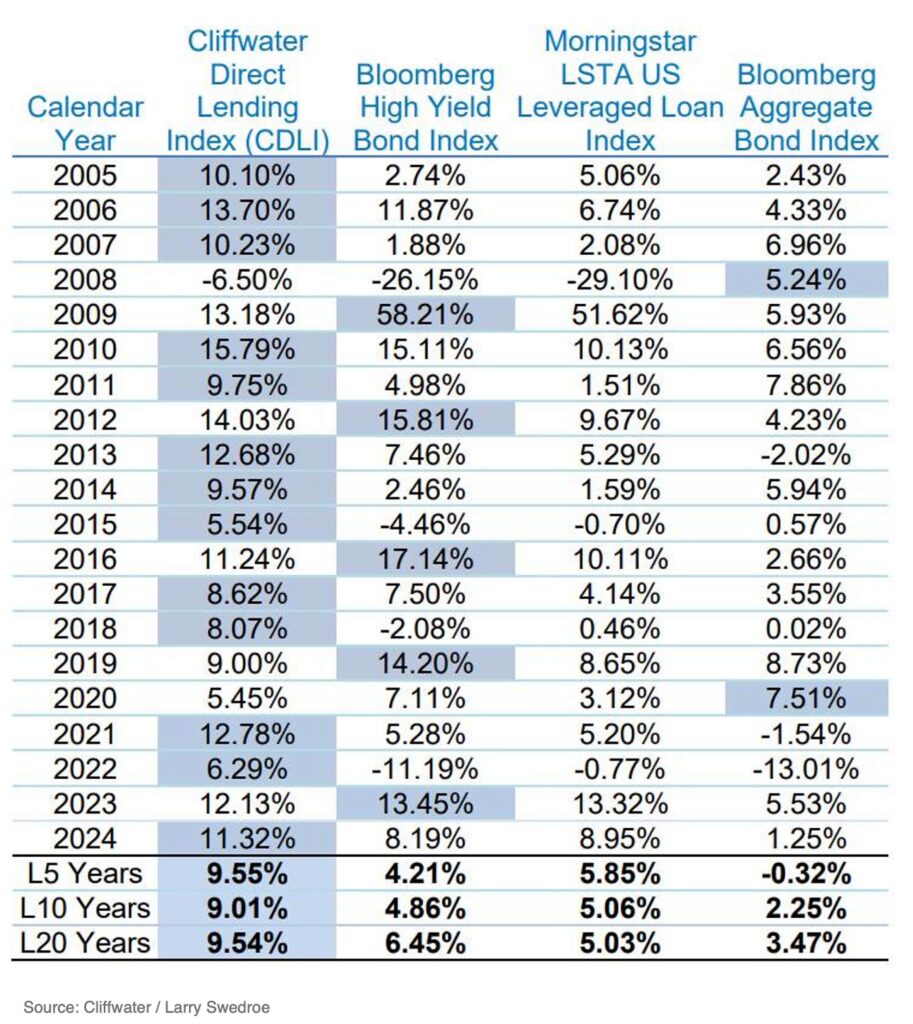
The history here is noteworthy. In 21 calendar years, the CDLI (Cliffwater Direct Lending Index) has posted a negative return exactly once — 2008, at -6.50%. In that same year, high-yield bonds lost 26%, leveraged loans lost 29%, and the S&P 500 fell 37%. Private credit’s maximum drawdown during the worst financial crisis in 80 years was roughly -8%, and it fully recovered within a year. By contrast, the Russell 3000 (US Stock Market) fell 46% from peak-to-trough and took 4.5 years to recover.
The 20-year annualized return for the CDLI is 9.54%. Comparable figures: High Yield at 6.45%, Leveraged Loans at 5.03%, and Investment Grade US Bonds at 3.47%. Preliminary data from Cliffwater (as of 2/23/26), shows continued strong performance of 9.33% for full-year 2025.
The argument here is not that private credit never suffers losses. If you are lending at 8–10% to non-investment-grade borrowers, some of those borrowers are going to default. That is not a scandal — it is what you are being compensated for. The question is whether income consistently exceeds credit losses by a wide enough margin to deliver attractive net returns. Historically, it has.
Dispersion is the story, not distress
One of the most important things to understand about private credit today is that the headlines are treating a deeply heterogeneous market as the same. The term “private credit” covers everything from senior secured first-lien loans to large, sponsor-backed companies to venture lending, mezzanine debt, asset-based finance, and infrastructure credit. The risk profiles across these categories vary widely.
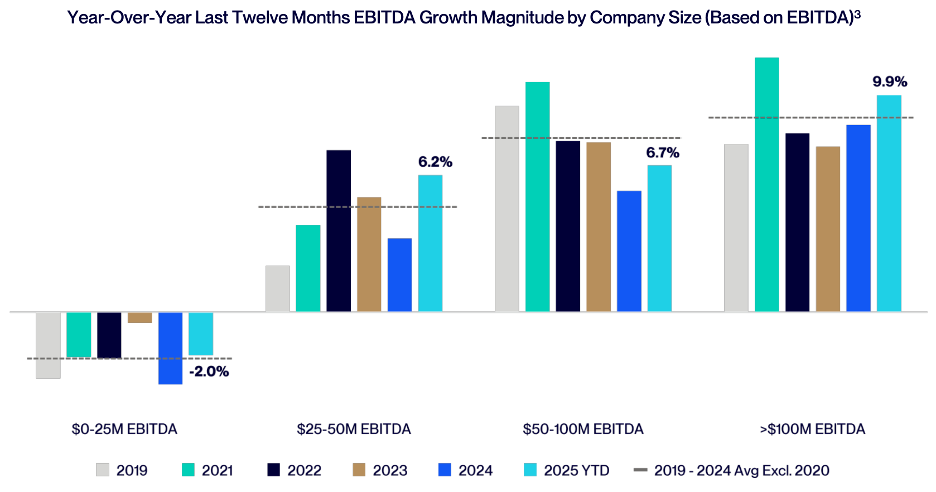
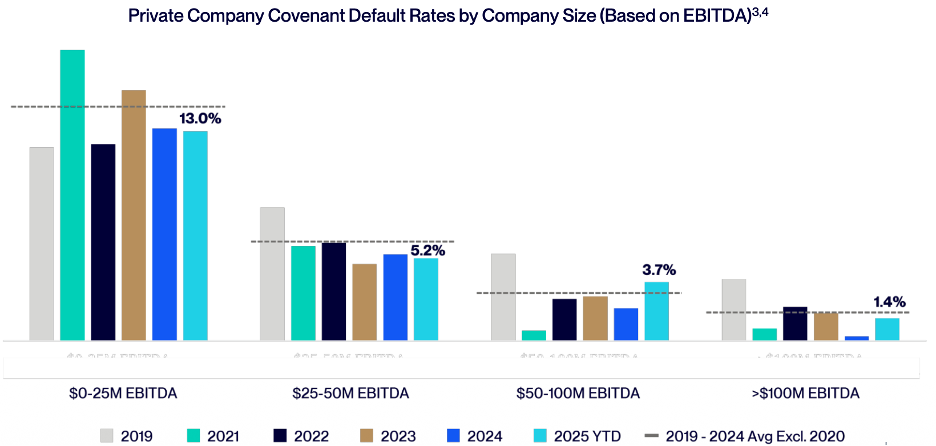
For example, data from Lincoln International (as of September 30, 2025) shows a substantial gap between the best and worst segments of the market. Upper-middle-market companies — those with $100 million or more of EBITDA — posted trailing twelve-month earnings growth of nearly 10% and a covenant default rate of just 1.4% (a covenant default means the borrower broke a loan rule, not necessarily that it stopped paying). The smallest borrowers, under $25 million of EBITDA, saw earnings decline 2% and covenant defaults of 13%. That is roughly a 9-to-1 ratio in default experience between the top and bottom of the market.
This is why generalizing about “private credit” is where the mistake usually begins. A senior secured first-lien loan at 45% loan-to-value to a $500 million EBITDA company backed by a top-tier sponsor has almost nothing in common with a subordinated loan to a $20 million EBITDA company with no sponsor backing.
The two most prominent blow-ups of the past year — First Brands and Tricolor —reinforce rather than undermine this point. Both were bank-led syndicated deals, not private credit transactions. First Brands involved approximately $5 billion in first-lien term loans and, per the DOJ’s October 2025 criminal investigation, roughly $2.3 billion in fabricated receivables. This was a fraud — a failure of bank-syndicated underwriting, not of the direct lending model.
Shorter duration is an under-appreciated feature
One structural advantage that gets little attention is duration. Private credit loans are typically shorter in duration than public fixed-income instruments. Most direct lending facilities carry maturities of three to five years, and many reprice or refinance well before maturity. This means that in a period of rapid change — say, AI disruption reshaping the software sector — a private credit portfolio’s loan book turns over meaningfully faster than a comparable allocation to long-duration bonds or even leveraged loans with seven-year maturities.
That natural rollover provides a built-in mechanism for underwriters to reassess risk, reprice, and reallocate. It does not eliminate the risk of holding a loan that deteriorates mid-term, but it shortens the period of exposure relative to longer-dated instruments.
Gating is a structural design, not a distress signal
The gating of redemptions at several private credit funds has attracted some of the most emotional coverage. When multiple funds hit their quarterly 5% of NAV redemption caps at the same time, it understandably feels alarming, and comparisons to bank runs are easy to make.
But that framing can be misleading. Private credit loans are negotiated, privately held instruments that do not trade on an exchange and are not meant to offer daily liquidity. They are less liquid than public bonds or loans, and investors are compensated for accepting that constraint through higher expected yields — the illiquidity premium. For that reason, vehicles that hold these assets should be built with redemption terms that match the liquidity profile of the underlying portfolio.
Viewed in that context, gating is not automatically a sign of credit stress. It is a mechanism designed to prevent a fund from having to sell assets quickly, potentially at discounted prices, simply to meet withdrawals.
It is also important not to assume that redemption activity is tightly linked to portfolio performance. Investors may redeem for many reasons: rebalancing, liquidity needs elsewhere, changes in risk appetite, allocation shifts, or discomfort with limited-liquidity structures during periods of negative headlines. A fund can face elevated redemption requests even when its underlying loans are performing broadly as expected, just as a weaker portfolio can avoid redemptions for a time if investors remain patient or locked up. Redemptions tell you something about investor behavior and vehicle design, but by themselves, they do not tell you the full story about asset quality.
That does not mean gates should always be viewed positively. They are only reassuring when paired with defensible valuations, clear investor expectations, and portfolios whose underlying credit performance remains sound. But when those conditions are met, limited liquidity can be a feature rather than a flaw: it reduces the risk that remaining investors are harmed by forced selling at exactly the wrong time.
That framing also appears consistent with how major managers are behaving. Blackstone injected $400 million of personal and firm capital into BCRED this quarter to meet 100% of redemption requests at current NAV — a notable signal of confidence in the portfolio and the valuation.
Where we are positioned
In a market where dispersion is rising, what matters most is not private credit in the abstract, but who is making the loans, how they are underwritten, and how the portfolio is constructed. Our focus is on managers with long records through real credit cycles, an emphasis on senior secured lending, and a willingness to prioritize discipline over volume. We are especially drawn to managers lending to larger, better-capitalized companies, where the margin for error is typically wider and the outcomes have tended to be more resilient.
That positioning matters. Direct lending today generally begins with a meaningfully larger equity cushion beneath the lender than in prior cycles. Average loan-to-value ratios are about 45% today, versus roughly 65% before the Global Financial Crisis and close to 90% in the late 1990s. Put simply, lenders are generally sitting higher in the capital structure, with more borrower equity beneath them to absorb losses before the lender does.
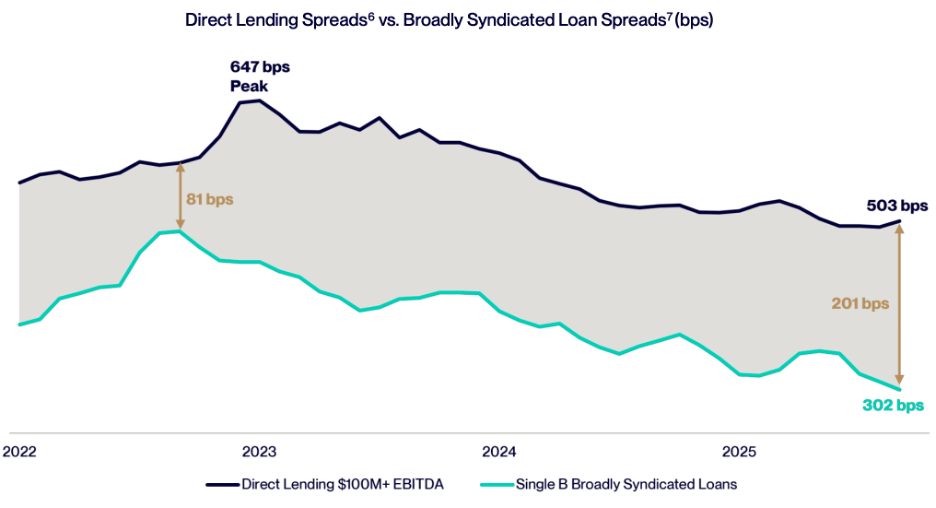
The compensation for owning these loans also remains attractive. As of Q3 2025, direct lending to companies with more than $100 million of EBITDA was still earning roughly 2 percentage points more than comparable broadly syndicated loans. That spread premium is simply the extra yield private credit offers over a similar public-market loan. In other words, even after yields have come down from their peaks, investors are still being paid meaningfully more to own less liquid, privately negotiated credit.
None of this eliminates risk. PIK usage has risen at the margin, which is worth monitoring closely. PIK, or “payment in kind”, means that a borrower pays part of its interest by adding it to the loan balance rather than paying it in cash. In some cases that is a sensible structural feature; in others, it can be an early sign that cash flows are under pressure.
There are also pockets of the market where caution is clearly warranted. Software-heavy portfolios face genuine uncertainty as AI reshapes competitive dynamics, and some of the more bearish forecasts are rooted in real vulnerabilities. But the most severe outcomes now being discussed generally assume recession-like deterioration that has not materialized. For context, default rates above 10% have been extremely rare in credit, occurring only once at the peak of the Global Financial Crisis in 2009, and direct lending — where most of our exposure sits — has historically remained well below that threshold.
The bottom line
Private credit is broad and increasingly differentiated. The results are strongest where underwriting is disciplined, loans are senior secured, borrowers are larger and better capitalized, and vehicle structures match their underlying assets. This is not a blanket defense of everything in private credit — there are corners of the market where leverage is too high, borrowers are too small, and structures are mismatched. Those exposures will face real losses, and some already are.
But for well-constructed portfolios at the upper end of the quality spectrum, the data – 21 years of it, through five distinct credit cycles – supports a straightforward conclusion: private credit has historically taken shallower drawdowns than public risk assets, generated income that is well in excess of realized losses, and recovered quickly.